

 Live / group
Live Data Analytics Course
About this course
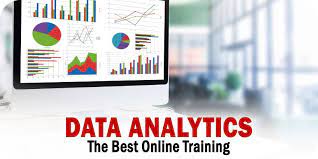
Data analytics is the process of examining and interpreting data sets to extract valuable insights, identify patterns, and make informed business decisions. It involves various techniques and tools to analyze and visualize data.
- Define Objectives: Clearly outline the goals and objectives of the analysis.
- Data Collection: Gather relevant data from various sources.
- Data Cleaning: Clean and preprocess the data to handle missing values and inconsistencies.
- Exploratory Data Analysis (EDA): Explore the data through statistical summaries and visualizations.
- Data Modeling: Apply statistical or machine learning models to extract patterns and predictions.
- Data Visualization: Present the findings through charts, graphs, and dashboards.
- Interpretation: Draw conclusions and make data-driven recommendations.
Data Extraction: SQL is often used to extract data from databases for analysis. Power BI can connect to SQL databases to visualize this data.
Data Transformation: Power BI's Power Query can be used for data cleaning and transformation before analysis. SQL queries can also be employed for initial data preprocessing.
Data Analysis: Both Power BI and SQL are crucial for analyzing data. SQL can be used for complex queries and aggregations, while Power BI provides interactive visualizations.
What you'll learn
Course content
5 modulesYour instructor

7-day Money Back! Guarantee
Not right for you? Full refund within 7 days or after 2 classes - no questions asked.
This course includes
 Level: Beginner
 Session: Group
 Duration: 24 Hours
Courses you might be interested in
 Live / group30 HoursBeginner
Machine Learning Made Easy – Start Coding Smarter


Money Back! Guarantee
 Live / group24 HoursBeginner
Live Online Mobile App Development Course – Junior Level

Money Back! Guarantee
 Live / 1-on-124 HoursBeginner
Live Online Mobile App Development Course – Junior Level

Money Back! Guarantee