

 Live / group
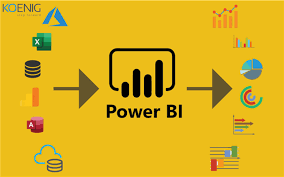
Power BI Course
About this course
This course offers a hands-on approach, guiding participants through the entire data analytics lifecycle, from importing and transforming data to creating insightful visualizations and sharing actionable business intelligence reports.
Course Objectives:
Introduction to Power BI:
- Gain a fundamental understanding of Power BI and its role in data analytics.
- Explore the key features and components of the Power BI ecosystem.
Data Preparation and Transformation:
- Learn how to import, clean, and transform data for effective analysis.
- Utilize Power Query to shape and refine data for optimal insights.
Data Modeling and Relationships:
- Understand data modeling concepts and create relationships between tables.
- Implement best practices for designing efficient data models.
Building Interactive Visualizations:
- Master the art of creating visually compelling reports and dashboards.
- Explore various visualization types and their appropriate use cases.
Advanced Analytics with DAX (Data Analysis Expressions):
- Develop proficiency in writing DAX formulas for advanced calculations.
- Implement time intelligence functions and other advanced analytics techniques.
What you'll learn
Course content
5 modulesYour instructor

I am a Power BI and Excel expert/Trainer with experience in data visualization and exploratory data analysis. I have experience in drafting Dax/excel Formula commands to help you achieve the desired outcome and create dashboards that are actionable, insightful and attractive. I have extensive experience in: - Understanding the data and presenting it in a way that the end user can action from - Moving quickly to create basic visualizations using Excel tools and features - Implementing dashboards with A
7-day Money Back! Guarantee
Not right for you? Full refund within 7 days or after 2 classes - no questions asked.
This course includes
 Level: Beginner
 Session: Group
 Duration: 40 Hours
Courses you might be interested in
 Live / group30 HoursBeginner
Machine Learning Made Easy – Start Coding Smarter


Money Back! Guarantee
 Live / group24 HoursBeginner
Live Online Mobile App Development Course – Junior Level

Money Back! Guarantee
 Live / 1-on-124 HoursBeginner
Live Online Mobile App Development Course – Junior Level

Money Back! Guarantee